DIGITAL PR / ART DIRECTION
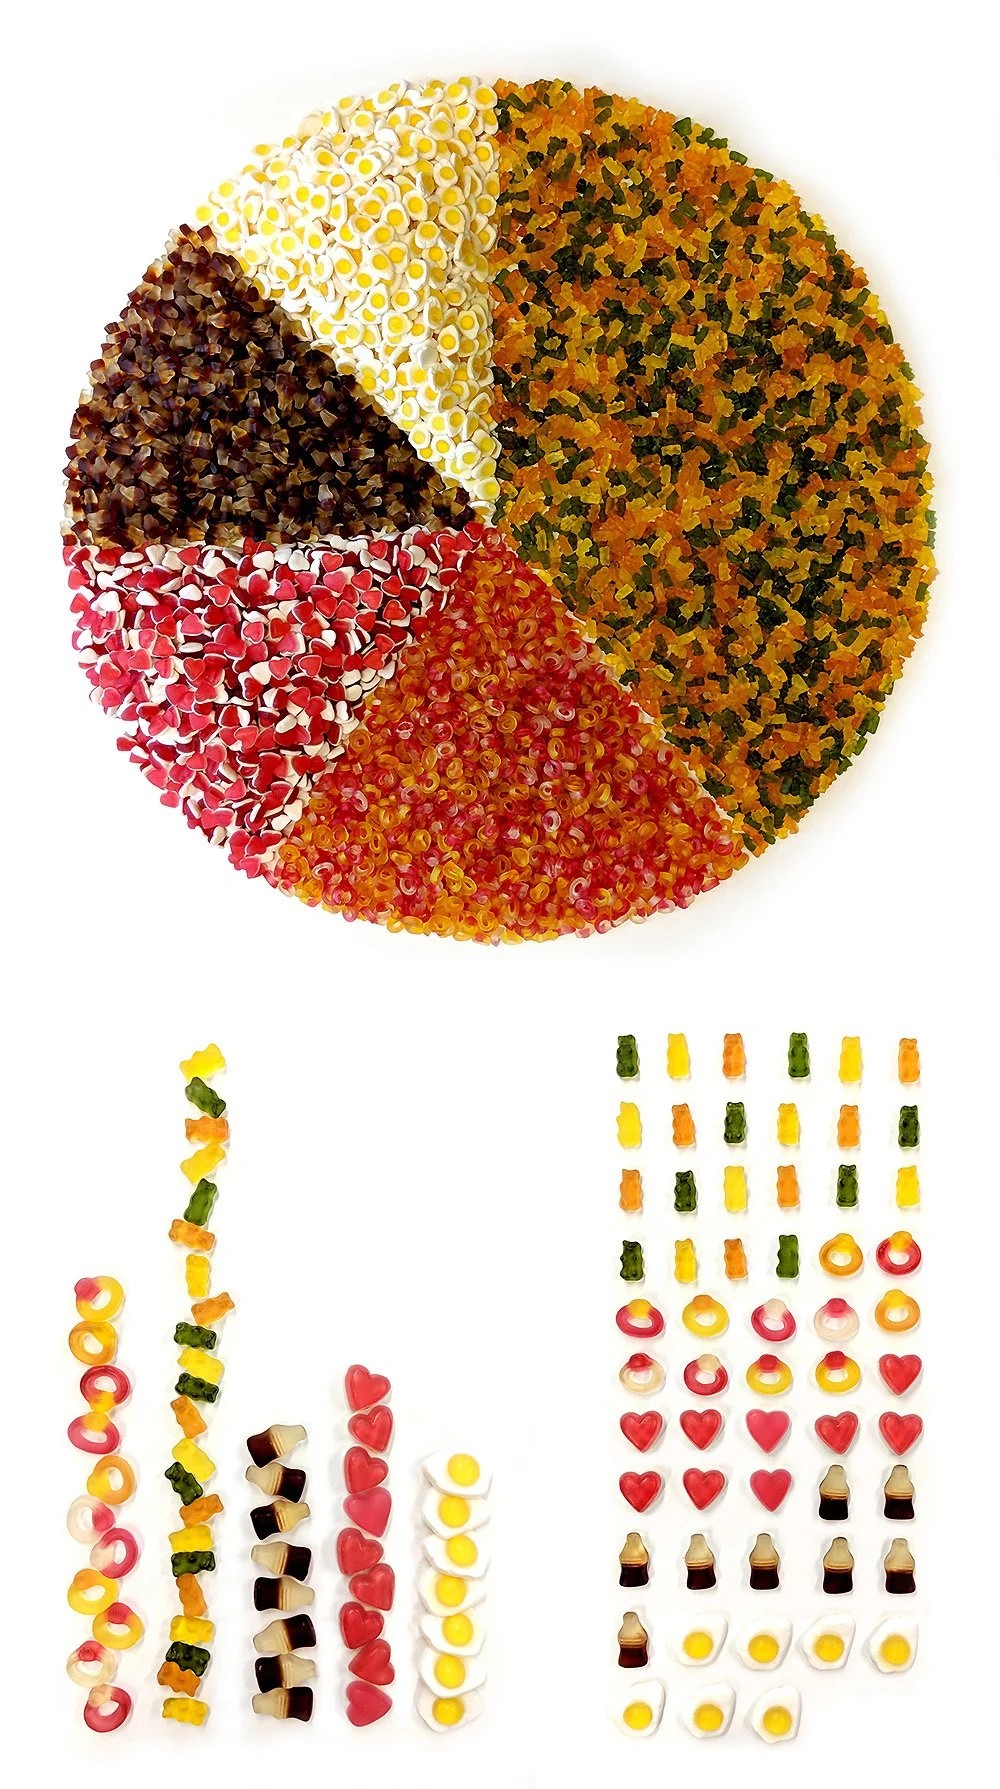
Creative data visualisation with over 5,000 Haribo
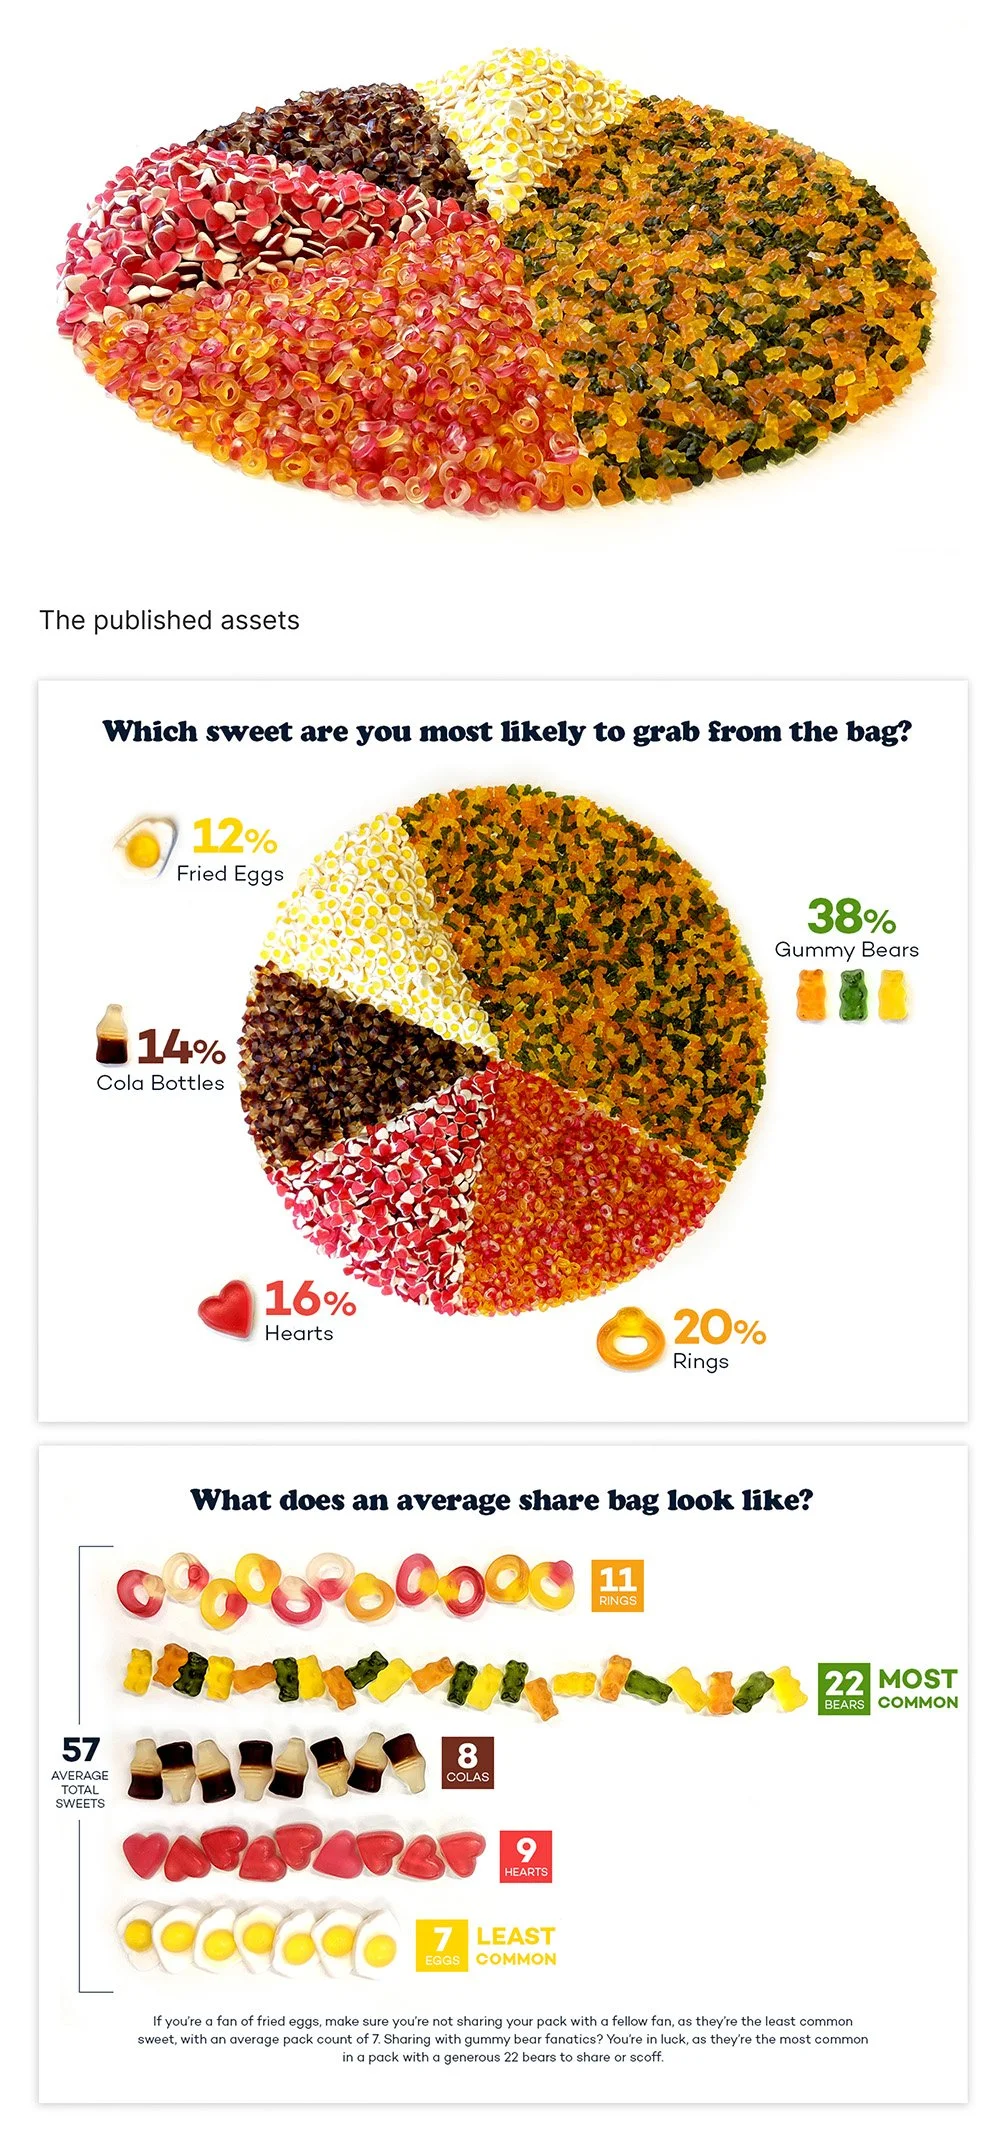
The thought process behind this digital PR work to showcase the results of opening 100 bags of Haribo, to was to not let the research process itself go to waste.
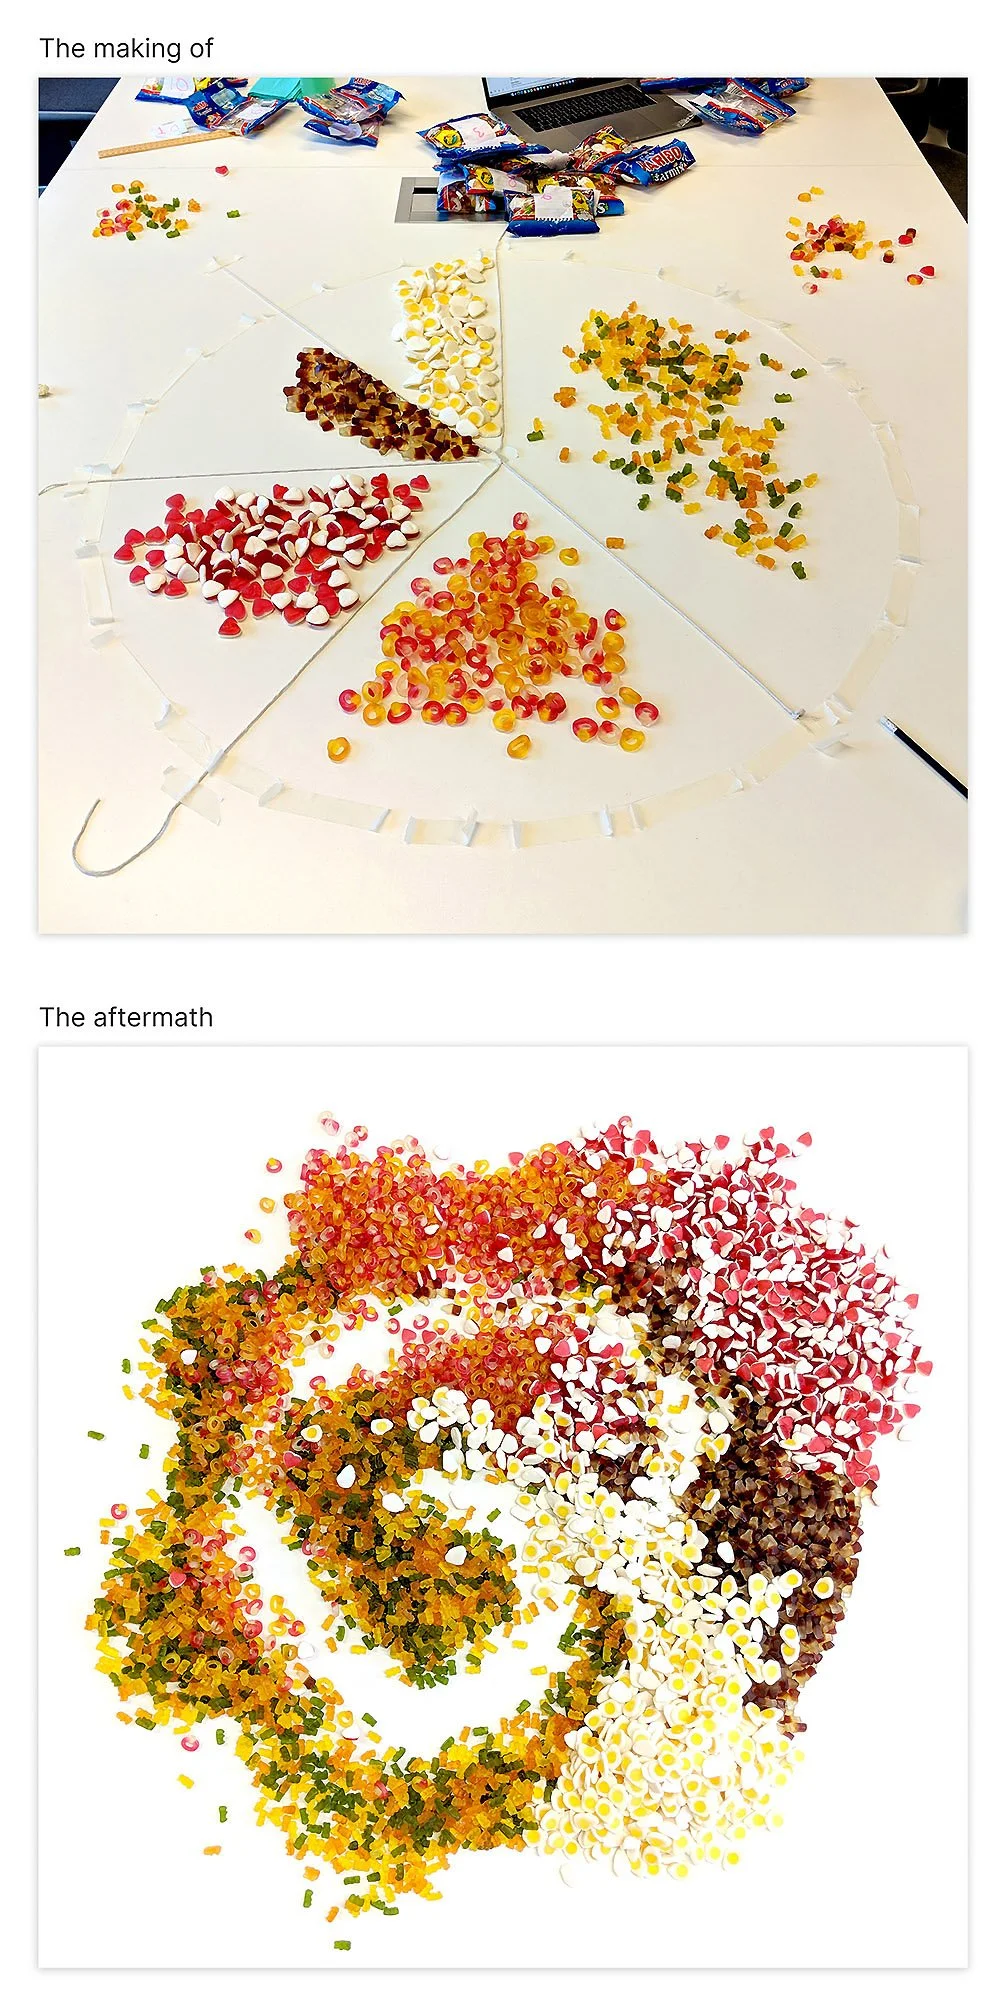
With almost 6,000 sweets at our disposal, once the initial findings were recorded, I created a 4ft-wide pie chart comprising of all the sweets, alongside leading my team to create additional visualisations.
The campaign went on to earn coverage in national outlets such as The Metro and was shortlisted for an Information is Beautiful Award.