DATA STORYTELLING / ART DIRECTION
NeoMam Studios:
Selected Digital PR work
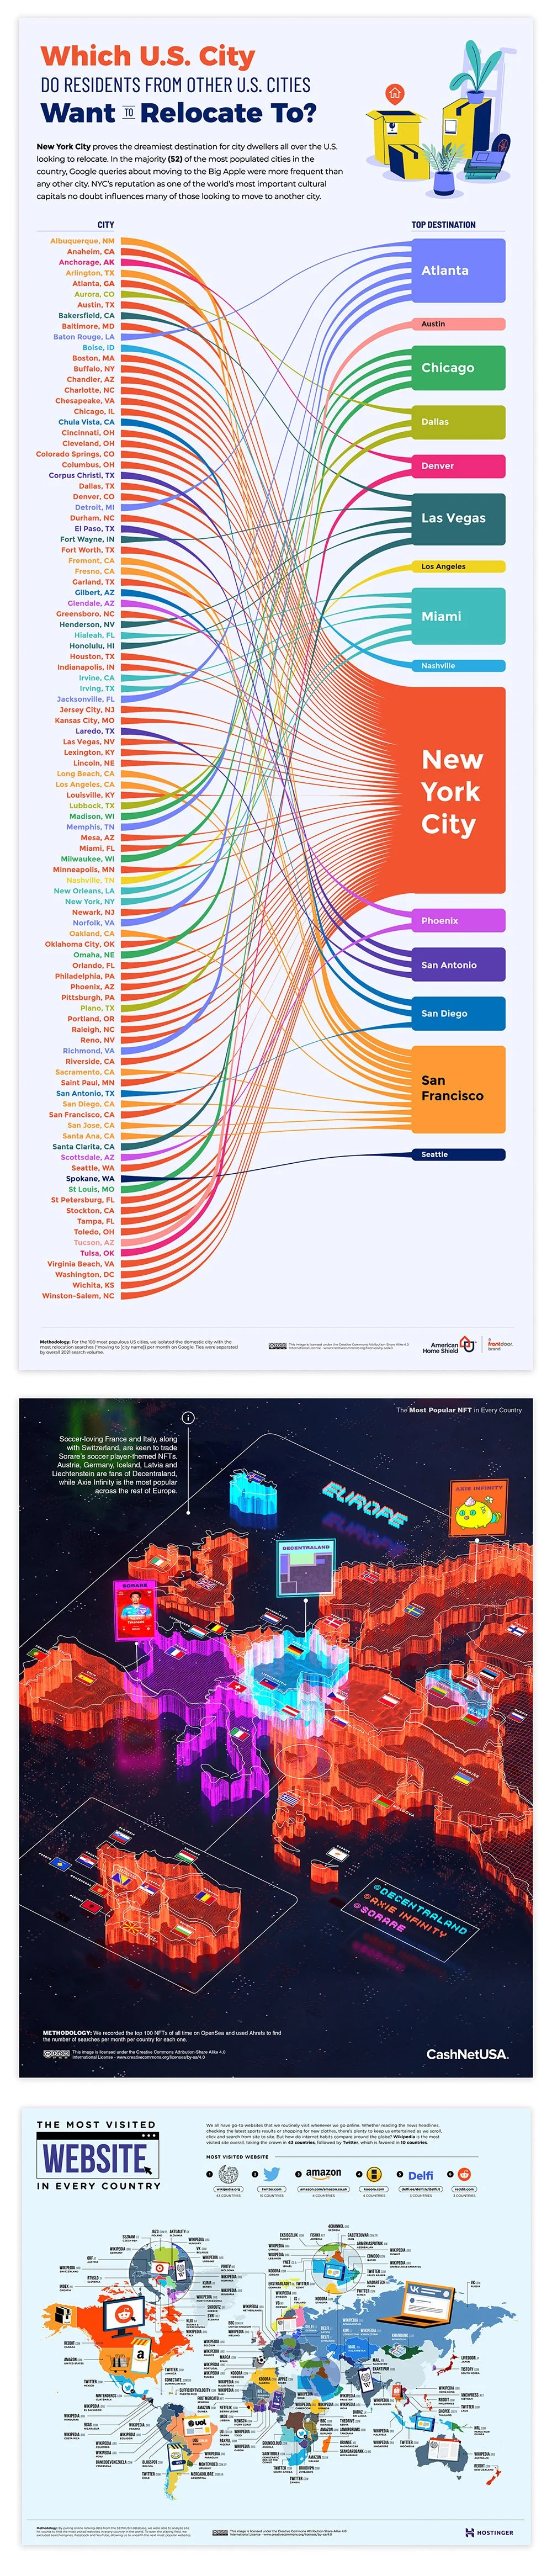
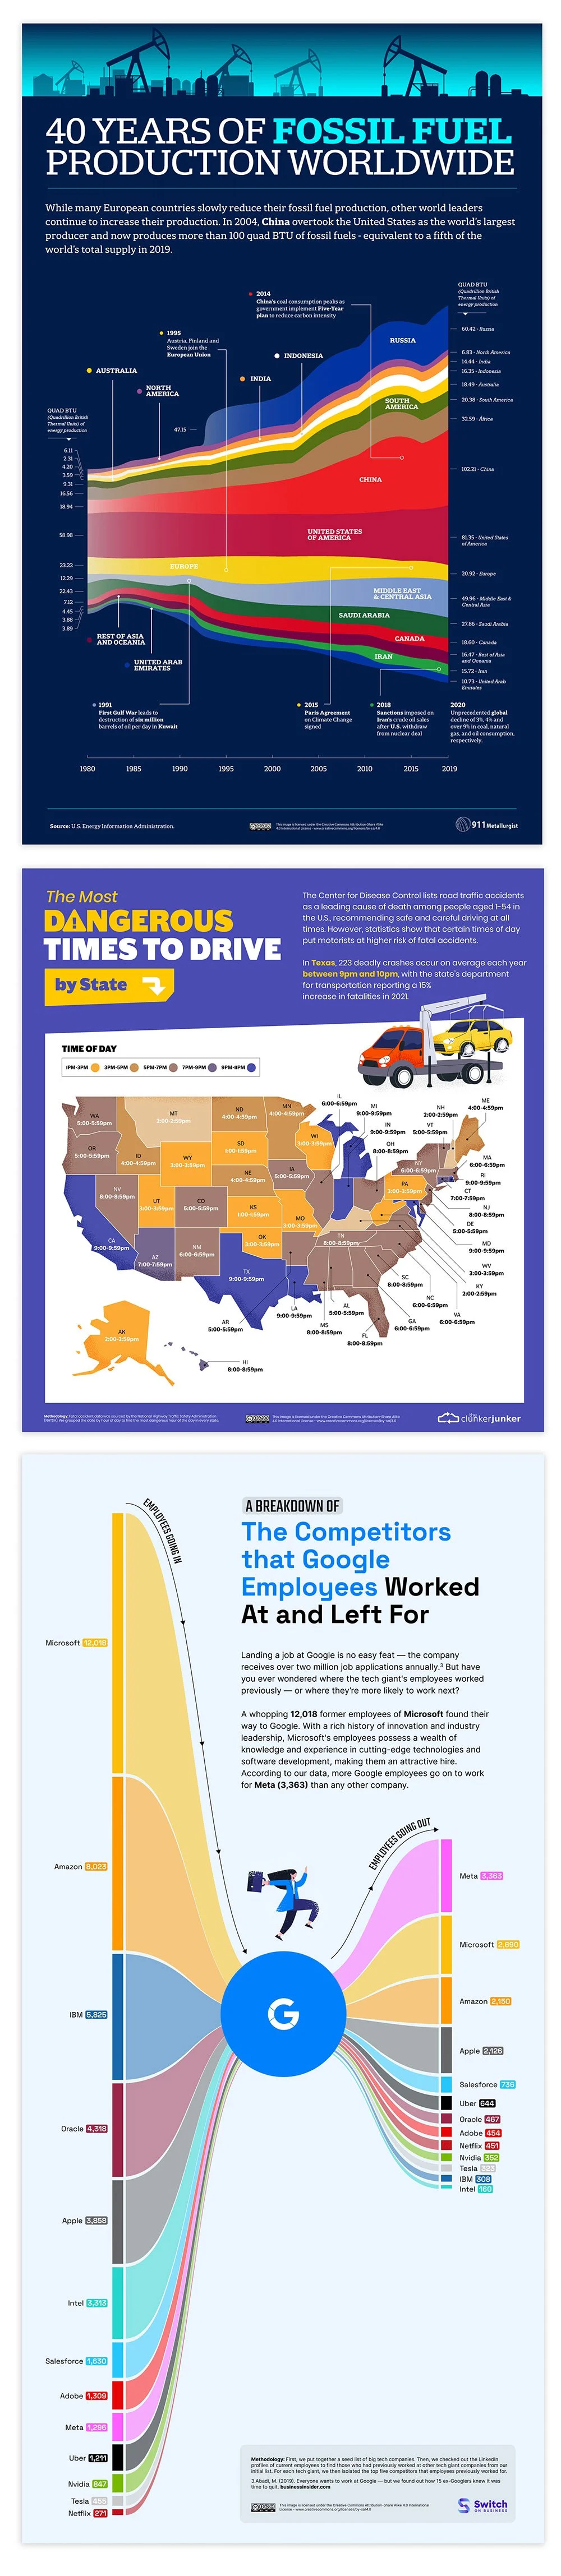
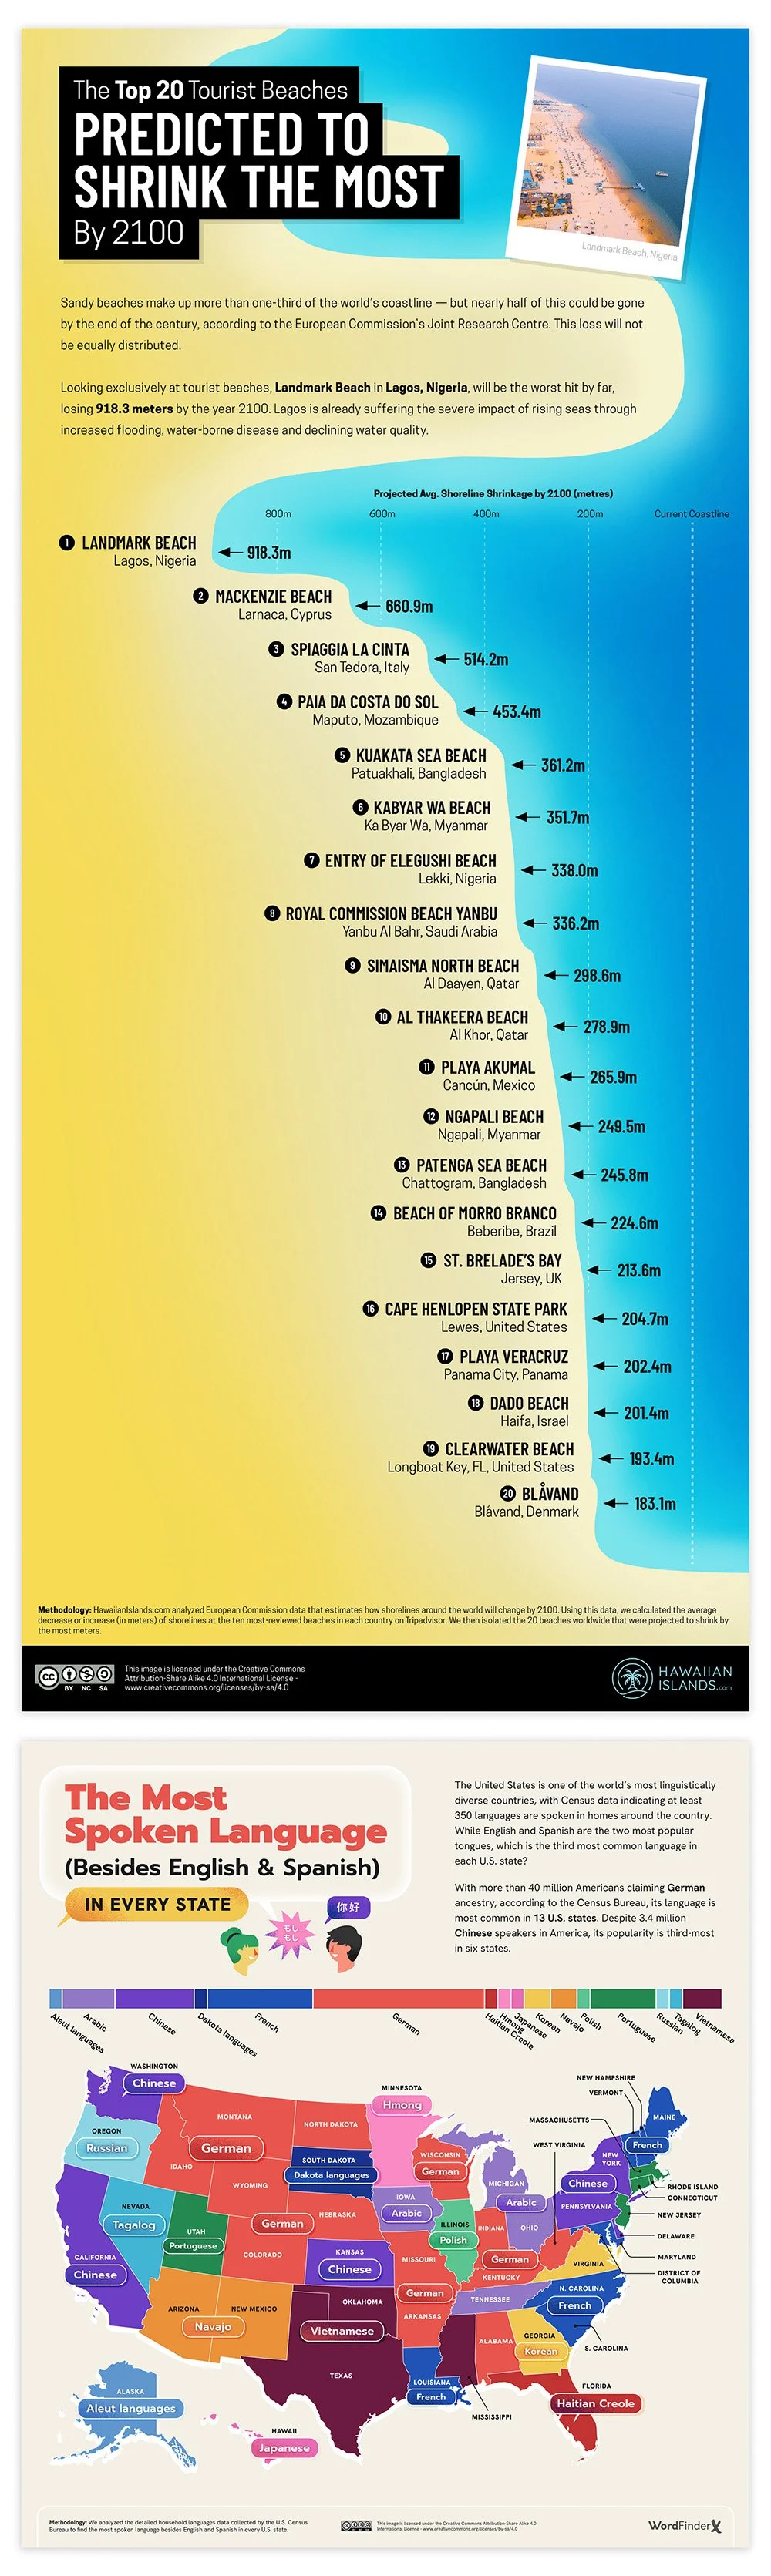
A selection of assets from projects I art directed while working as Design Lead at NeoMam Studios, a digital PR specialist where our campaigns gained coverage across a wide range of global publishers.
In this role, I guided projects through the full design process, including:
Working with the Creative Director to help define how research or data would be visually presented.
Collaborating with data analysts to understand the research and identify key angles.
Moodboarding visual styles, ensuring effective use of colour and hierarchy to showcase data.
Collaborating with freelance designers and developers to produce static and interactive assets that were visually engaging and shareable.